

Don't fight the Fed!
A brief history of the financial plumbing since WW2, and the role of the US dollar

Introduction
Hi, welcome to the HighVol newsletter! This is the first post, and we’ll discuss how the current financial system came to be- what drives it, and how it works. Its going to be a long one- grab a coffee, and read on!
The present financial plumbing as we know it, began in the aftermath of the Second World War. The victorious Allies were careful not to repeat the mistakes after the Great War ( World War 1) - imposing harsh unbearable financial penalties on the losers. The end of WW2 left 2 major superpowers- the United States and the Soviet Union. The British empire was dismantled. Continental Europe was almost completely destroyed. Tens of millions dead, uncountable wealth destroyed- lands laid waste. The USSR had taken enormous losses as well.
In Asia, swathes of China were occupied by Japan since the 1930s, and was finally free. Right after, it plunged into civil war between the Nationalists and Communists. The Communists eventually won the mainland in 1949, and the Nationalists took refuge in Taiwan, protected by US. Japan itself had been bombed heavily and its industrial base destroyed by US, aside from the nuclear bombs. India was more or less intact, but its economy was too insignificant to make any major impact on world growth, around the time of the British departure.
For most of human history, precious metals were currency. Gold, or silver. Copper was used for small denominations. This was well suited for a pre industrial era, where growth was slow, if at all. Inflation was almost zero for decades or even centuries at times, and living standards rose very slowly.
A gold backed currency meant you could create credit only if you had the gold. You could get the gold by either mining it- which is a very small quantity vs how much is needed. Or you earn it through exporting goods. To export, you need to be competitive in the international market. If you are a war torn country, gold is scarce. Consequently, so is credit. Lack of credit hinders business and competitiveness, which in turn means no exports and thus no gold. This was a catch-22. Similarly, for the importing country, it runs the risk of running out of gold by running persistent deficits, thus causing a credit crisis in its economy. Which surviving country had gold to spare for affording imports? None.
1944- 1971: A New world order, The Bretton Woods System
As the war ended, the Allies got busy planning a structure for global trade and currencies for the post-war world. A conference of over 40 free countries took place at Bretton Woods, New Jersey in 1944. The United States had emerged intact from the war, with a much bigger industrial base and economy. This offered a way out for European reconstruction. For starters, currency exchange rates were pegged, allowed to float within a very small range from the fixed rate. Central banks were to intervene and bring the rate back within range if needed. The underlying bedrock for this system was the United States Dollar.
The US was to become both the customer as well as banker for Europe. The US dollar was already backed by gold- convertible at a fixed rate of 1 ounce= $35. It had the world’s largest economy, biggest consumer market. The dollar was far more convenient to use for trade than gold. You could borrow almost any sum from a bank. Transfer it anywhere cheaply. It was accepted anywhere, and was as good as gold! Europe focused on exports to US, with its vast purchasing power and consumer demand. This enabled it to grow much faster than it could have otherwise. Europe’s internal consumer spending and incomes had collapsed after WW2.
A similar pattern repeated across the other side of the world- with Japan and Korea. In the early years, US exported a lot of goods to its partners, so trade was fairly balanced. But starting in the 1960s, after Europe had sufficiently recovered, US trade deficits exploded, and so did the demand for US dollars.
What the hell are Eurodollars?
Enter- Eurodollars. Contrary to the ‘Euro’ in the name, it doesn’t have anything to do with the currency. It simply means a deposit of US dollars held offshore outside US. With the world’s trade being settled in USD, demand far outstripped available supply of USD through just trade deficits. This led to foreign banks borrowing these dollars from the globally interlinked interbank market. We need to take a little detour to understand this-
Banks can get USD in roughly two ways-
Borrow at LIBOR (London Interbank Offered Rate)- The bank pays another bank some interest at the rate of LIBOR + some premium based on its credit worthiness.
Currency swap- The bank does a currency swap with another bank that has excess USD and wants a currency that you have in excess. For instance a German bank with extra Deutsche Marks may do a currency swap to get USD. Why is this a good alternative? Interest rates. It may cost a German bank 4% to borrow US dollars directly, but only 2% for Marks. The other bank has the same situation in reverse, can borrow Deutsche Marks @ 4%, but can borrow USD at 2%. So the two banks borrow in their own currency and do a currency swap, so both of them save 2%.
The dollars are not physically transferred, but simply digital entries between counter-parties. They are settled by netting out transactions. Two banks may have thousands or millions of transactions between them each quarter. They net out the amount payable, keep aside some percent of the transaction value as collateral for each transaction and make only a net payment.
Banks make money when they borrow at a lower rate, and lend it out at some rate higher. In the above case, the German bank that borrowed USD may be paying 2% initially and lending it out at 5%. If LIBOR went up 1%, they would now be paying 3%, taking away some of their profit. If the rate drops to 1%, then they pay less and make more profit.
In a crisis, as everyone tries to get USD, the borrowing rate goes up, increasing costs for everyone. If the cost rises too high, it triggers a liquidity crisis as some banks are unable to make payments. Remember how these transactions are settled? By netting. Netting assumes that everyone in the network is able to pay. If some fail, the net now turns into gross. If I don’t get paid, I can’t pay further. Everyone fails, and we get a global banking crisis!
This is why Central Banks play a very crucial role- they can create unlimited amounts of currency as well as control the interest rate on it. This can be lent to banks at rates low enough to enable the system to continue functioning. In 2008, after Lehman Brothers failed, The US Fed lent out hundreds of billions of dollars to keep the system from falling apart, as did the European and Japanese Central banks.
1971-1980: The Dam Breaks, End of Bretton Woods
Back to history- since the US dollar was convertible to gold, it was assumed that its supply would be constrained, and retain its value. As the Eurodollar market exploded, dollars started to be created out of thin air in the interbank market, backed only by a stream of interest payments to borrow them. US banks were now creating the dollars on their balance sheet, lending them out for interest, and as collateral for these loans, borrowed from the US Federal Reserve at a cheaper rate. In turn, the European or Asian bank that got these USD, further turned it into more Dollars using their original USD as collateral by re lending them out at a higher rate.
This flood of USD across the world led to both Europeans and Americans realising the peg to gold at $35 was unsustainable. The rate was fixed in 1944. It had not accounted for inflation or growth since then. The amount of Dollars was far in excess of available gold. In 1971, President Nixon formally announced that the gold peg was gone. The US dollar was no longer backed by gold! This was a huge announcement! The bedrock of the global currency system had come undone. With the dollar peg gone, so did the other currency pegs. Currencies started floating against each other in real time.
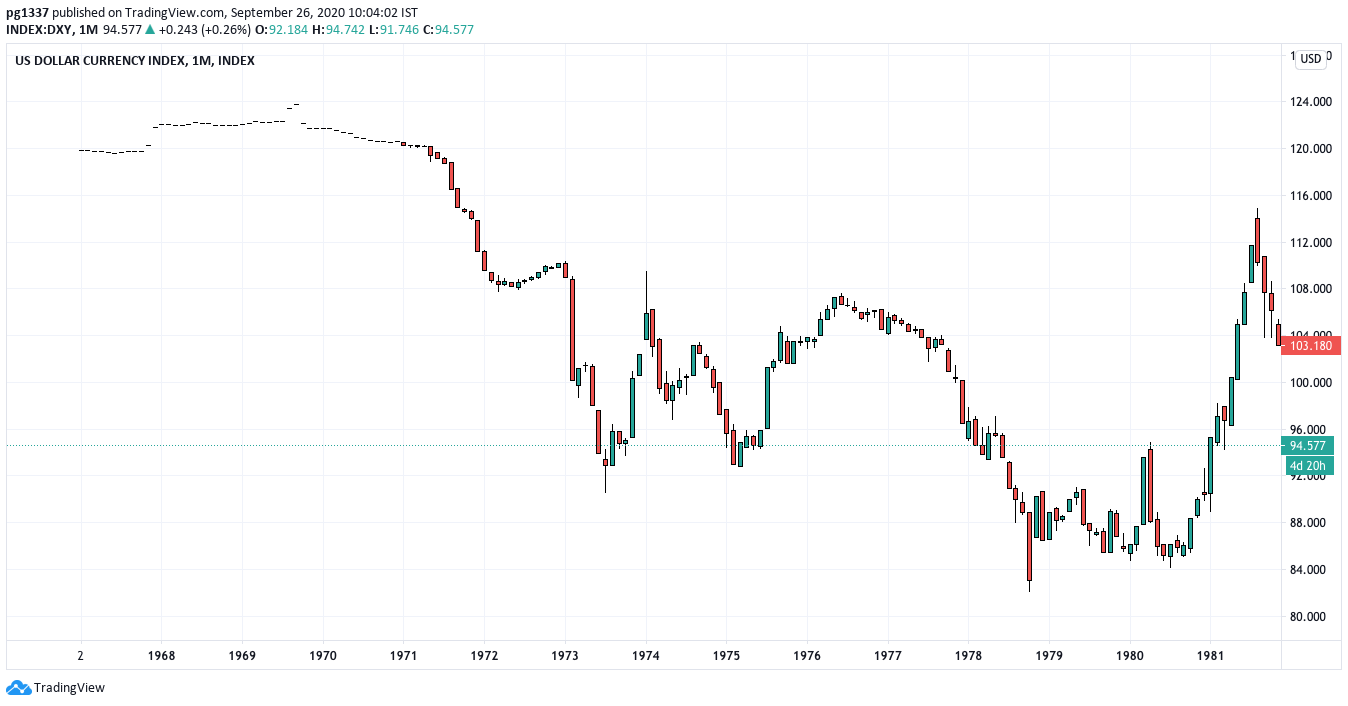
The delinking with gold had a severe effect on the Dollar in the decade from 1971. The Dollar lost ~30% of its value against its peers. Below is a chart of the Dollar Index (DXY), built from a weighed basket of Euro, Japanese Yen, British Pound and several others. The biggest component is the Euro. The DXY dropped from 120 to 84 by 1980.
What happened to gold? The exact opposite. After being pegged at $35 for over 3 decades, its price zoomed as it reflected the new fair value. From $35 in 1971, it had soared to $200 by 1975. After a brief lull for 2 years, it soared to $800/oz by 1980. This was an astounding 22x gain in little over a decade.

This reflected the high inflation and poor growth of this decade. This was highly unpopular in US. With a mandate to break inflation, Paul Volcker was appointed to the Chair of the US Fed in 1979. Despite the Dollar’s drop, US was still in a very strong position. Its demographics were solid, its military power was unchallenged, its industrial base was strong. The US Fed started hiking interest rates to kill inflation and defend the Dollar. Rates went from 5% to a monstrous 20% in just 5 years! Shown below is a chart of the Fed’s interest rates

1980-1985 Acche Din - The good times are back
In a free floating currency system, if country A keeps exporting to country B, it will end up with a lot of currency of country B. This should cause its own currency to appreciate against B, and make its exports less competitive- a self correcting mechanism. Countries like Japan kept their currencies artificially weak, enabling them to accumulate large dollar reserves from trade surpluses. This created a new problem. What should they do with these large stash of dollars? In 1980, it had an easy answer- buy US govt bonds yielding 20%. Extremely creditworthy, with 20% interest rates and a currency that had recently depreciated.
This gave rise to a new kind of trading- the carry trade. Borrow in your local currency at a lower rate, and buy a higher yielding currency and pocket the difference in interest rates. A Japanese investor could borrow Yen at 5%, swap it for Dollars, and make 10%. After a year, he converts the USD back to Yen, pays back the 5% and keeps the remaining 5%. As large sums of money got allocated to this, the demand for USD went up again, and the Dollar started rising. From the Dollar Index low of ~80 in 1980, it went all the way to 160 by 1985. This meant gigantic profits for the carry traders. Not only did they make money from the interest rate difference, but also from the exchange rate as the currency they had bought almost doubled in value.
1985-1990: Plaza Accord and the Japanese Bubble
This created a problem for the Americans- the Dollar was saved, but the strength of the Dollar now meant that imports were far cheaper. American businesses simply couldn’t compete anymore with Japanese or German imports, as their currencies were too cheap!
Negotiations followed, and resulted in the Plaza accord of 1985- representatives of West Germany, France, UK, US, Japan met and decided to take coordinated action to devalue the US dollar, and especially appreciate the Yen, which was perceived as too cheap. The US had already started cutting rates after they peaked at 20% in 1980, this continued till 1990.
The Plaza Accord was watched closely by investors, and money flowed into Japan. It was the most obvious trade of the time- Japanese Yen was going to be much stronger, the Dollar was going to weaken. In the 5 years from 85-90, the Dollar Index dropped 50% back to 80.

The Japanese Yen went from 240 to a Dollar, all the way down to 120

The green arrow marks the timing of the Plaza Accord. The carry trade had reversed. As money came into Japan, it didn’t just go into the bond market. It went everywhere. Real estate, equities, into anything foreigners could buy. The Japanese index Nikkei 225, went up 400% in 5 years from ~10000 to 40000 by 1989. Like all speculative excesses, this too went overboard. It is said, that at the peak of the bubble, the land under the Emperor’s Palace in Tokyo was worth more than all the land in California.
Like all bubbles, this bubble also popped soon. The Nikkei crashed in 1990, and crashed so bad, it has yet to see the high of 40k, even 30 years later. For a buy-and-hold investor, the loss of capital is practically permanent.

1980s: Latam Crisis
In parallel to the developed economies, countries in South America had also borrowed in Dollars heavily in the 60s and 70s. As interest rates spiked in US, the countries were unable to pay. As conditions for a bailout from the IMF, they were required to open up their markets, and impose harsh austerity measures. Argentina defaulted twice in the 80s, and everyone saw living standards drop for over a decade.
1990 -1995: India almost defaults, USSR falls
By 1991, oil prices had dropped drastically from $30 to an average of $15-20/bbl and the USSR collapsed. India, which had been running a very closed economy and Licence Raj had become uncompetitive, and forex reserves were on the verge of running out. It went to the IMF for a bailout- similar to LATAM, India was required to liberalise its economy and open up its markets as a precondition. This was agreed to, and with its central bank’s gold as collateral, the IMF extended a loan that avoided a default.
By early 1990s, Japan, Korea, Europe were no longer competitive to export to US as wages had gone up, and local consumer purchasing power had also increased substantially. The US signed the NAFTA- with Canada and Mexico. While they were too small compared to Japan or Europe to affect the world economy, it did provide a boost to US as they off-shored some low margin industries. Offshoring to China also picked up pace, as US and Japanese companies capitalised on the relatively low labour costs and good infrastructure. South East Asia too saw large scale investment in factories and businesses for exports as supply chains were partly relocated from higher cost countries. Similar to the Japanese bubble, the money flowing into East Asia also drove up asset prices, and enabled cheap borrowing in USD.
1995-2000: Asian crisis, Russia defaults, tech bubble
In US, the internet took off, and the Fed cut rates again from 10% in 1991 to 4% by 1995. The rate cuts kicked off another asset bubble, and US stocks soared. Money flows into US resumed.
Similar to the Latin American crisis, where the countries borrowed too much in Dollars, the story repeated in 1997-98. Fund flows to SE Asia dropped as it went to US, and Thailand ran out of forex reserves. Unable to defend its currency peg to the Dollar, it gave up, and the Baht devalued sharply. The fall in currency meant the loan burden for a local company in USD went up drastically, leaving it unable to pay. The defaults spread across the banks and led to a crisis, that spread to Indonesia , South Korea and Taiwan. GDP and currencies both fell sharply. This contagion led to sharp fall in the oil prices, in turn causing Russia to collapse and default again.
In a domino effect, the Russian collapse led to wild moves in the US bond market as investors rushed for the safety of US govt bonds. LTCM (Long Term Capital Management), a gigantic hedge fund run by math wizards and Nobel Prize winers had massive positions that ran up huge mark to market losses. Eventually, the Fed had to step in and organise a bailout by a consortium of banks. It also cut rates to almost zero. This infusion of money revived the global liquidity, and most of it went into US stocks, peaking in March 2000.

The Nasdaq100 index had risen from ~440 to 4400 in 5 years from 1995 to 2000- 1000%, followed by an 80% crash back to 800 from 2000-02.
2000- 2008: A new century
The turn of the century brought about yet another crash- the end of the Dotcom bubble. The 9/11 attacks further affected US in 2001, and the economy was in recession. What was the solution? Cut rates of course. In 2001, China was admitted to the WTO ( World Trade Organization) with US support, despite not fulfilling some of the criteria for a market economy. It was expected that China would meet the requirements in a few years. The US -China relationship was a perfect combination for high growth. China made huge investments in infrastructure, had a very cheap labour force, and low oil prices made it dirt cheap to ship anything across the Pacific to US.
American factories were relocated from US to China at breakneck speed. Chinese exports and foreign reserves swelled. To maintain its edge, China kept buying US govt bonds to keep its currency artificially low. This put a lid on rates in US just as a real estate boom took off. Eventually, these loans would be packaged into Mortgage Backed Securities and sold off to yield hungry investors who wanted a USD denominated asset. The amount of Eurodollars created went through the roof. Costs stayed low.
Chinese investments in infrastructure created a huge demand for commodities, raw materials. Copper, steel, oil, anything that wasn’t nailed down started going up. Even gold, which had been falling since its peak in 1980, finally made a bottom in 2000 and started rising again, from a low of $200. Oil went from $20 to $150 by 2008.
By 2006, land prices had flatlined in US. Asset prices were too high. By 2007, lots of loans were turning bad. Creditworthiness had been thrown to the wind, and ratings agencies had rubber stamped garbage as AAA. The first cracks had started appearing by mid 2007.
2008: Armageddon
Starting in 2000s, there were not enough Mortgage Backed Securities (MBS) to go around. So banks created derivatives that replicated the payoffs with complex rules- CDOs ( Collateralised Debt Obligations). To hedge against defaults, they had CDS (Credit Default Swaps). By 2006, the volume of the derivatives was far in excess of the actual loans itself. As the loans started turning bad, its impact on the derivatives was magnified. To make up for the losses, banks had to borrow more and keep more collateral.
Familiar story follows- rates spike, some banks are unable to pay, and the system collapses. While the collapse of Bear Sterns was averted in early 2008, Lehman Brothers was allowed to fail in late 2008. This unleashed panic in the global financial system as everyone scrambled to get what they could. The Fed printed unprecedented amounts of USD and lent it out to banks and financial institutions across the world- amounting to hundreds of billions. This pales in comparison to the notional value of the outstanding derivative trades though- which runs in hundreds of trillions!
This time, the Fed not only cut rates to zero, but started buying assets directly. A lot of investors had burnt their hands on MBS, and the market for it had ceased to function. Without a market, it was impossible to price them. The Fed bought many at full face value, and restored order. Liquidity eventually returned to the system. Many of the loans made at the worst period of the crisis, ended up being repaid in full few years later. Not only did the Fed did not lose money, but instead made some on the bailouts!
After this, the Fed began what it called Quantitative Easing- the Fed will buy bonds from the banks for cash. This is incorrectly labelled as printing money and thought to cause inflation. The money does not go into anyone’s pocket to be spent. It is simply an exchange of a bond for cash on the bank’s balance sheet. If this is not lent out, it has no effect on the real economy or demand.
2009-2017: Boom times, shale oil and the oil price crash
No policy choice is without cost or knock-on effects. The unprecedented Fed intervention and QE, restored order in the short run. As purchases by Central banks became the norm, it affected the way bonds were priced and traded, as it was no longer a purely market price. The lowering of rates led to a hunt for yield, and stock valuations went higher. The same dollar of cashflow in future is worth much more today if rates are lower, and the stock markets went up straight from 2009 to 2018. There was a brief pause in 2011, as the Fed stopped its first QE, but quickly resumed. QE 2 and 3 followed. After that came operation Twist, where short term and long term rates were explicitly manipulated to keep them low.
This drop in rates, had another side effect, on the oil industry. Shale oil was technologically possible, but financially unviable. Rates going to zero, and the Arab Spring revolts in the Middle East sent oil back to $100. At the same time, it made borrowing costs dirt cheap, and suddenly shale oil became very viable. Large amount of debt financed exploration and drilling followed. By 2012, US was pumping a massive amount of shale oil and by 2014, the high oil price could no longer be maintained.
Starting mid 2014, the price of WTI crude ( the grade of crude from US) crashed over 50% from ~90 to 40s. It continued lower all the way down to 20s in early 2016. The oil price crash had further knock on effects. Oil exporters pegged their currencies to the USD and maintained through buying US bonds. Budgets had swelled to keep citizens happy in the aftermath of the Arab Spring , and now needed oil prices above $80 to sustain it. This went for a toss. The Russian Rouble sold off heavily, from 34 to a Dollar, all the way down to 70s. While Russia grappled with inflation, it staved off another default and collapse. On the other hand, this was a huge windfall for energy importers like Japan and India, providing an unexpected stimulus in a slowing economy.
Towards the end of 2016, Donald Trump won the US presidential election, and announced he would get to work on tax cuts immediately. Tax rates cut from 35% to 20%, meant an immediate boost in Earnings Per Share for all US companies. This led to a rerating of US stocks, and a global stock market rally in 2017.
The Fed finally felt comfortable enough to start hiking rates in late 2016, and picked up pace in 2017, comforted by markets rising and staying stable despite hikes.
2018-19: End of another cycle
By the start of 2018, the Fed had accumulated some $4+ trillion of bonds and mortgage backed securities. It had stopped purchases some time back, and starting end of Jan 2018, they had announced a gradual sale of its holdings. This was in effect, the reverse of QE. This was going to happen simultaneously with rate hikes!
The combined pace was too much for markets that were used to regular doses of stimulus, and we got the first major selloff in many years starting Feb 2018. Successive selloffs followed in October, and by December the market was down 20%. The Fed panicked, and backtracked. Rate hikes were put on hold. The market got some breathing room, and the uptrend resumed. The 1st green arrow marks where the Fed started unwinding its balance sheet- the 2nd shows where it put rate hikes on hold.

2020: The Pandemic
The selloff began in earnest on February 24 as the effect of Covid-19 started getting priced in, and by March 23, just a month later, it was down a whooping 35% ! As you would expect by now, the solution was the usual- the Fed steps in and saves the day. On March 23, the Fed announced extensive measures.
The chart below shows the S&P500 index futures chart, with green arrow marking the day of the Fed announcements. As they say, DFFF- Dont Fight the Funny* Fed

Final thoughts
This has been a long read. If you’re still around, thank you! It highlights the huge role the US Dollar and the Federal Reserve play in the global economy, and is often the cause of the start and end of most cycles. Its the lifeblood that keeps the world economy going, and nothing on the horizon is capable of replacing it yet. Chinese Yuan still uses Dollars as collateral, and so do oil exporters.
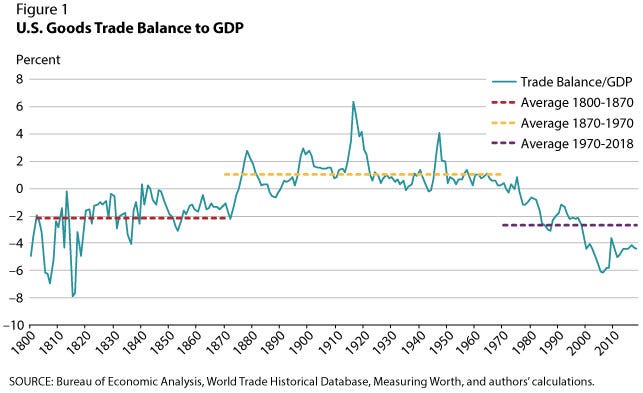
The system has given enormous advantage to US but not without costs. Supply of dollars required US to run trade deficits for decades, which hollowed out its industrial base and high paying jobs. When the pandemic hit, essentials were in short supply, and technical manufacturing expertise needed to ramp up production was missing. US cannot eliminate trade deficits without also cutting off the world’s access to Dollars. In a world that doesn’t use USD for its trade, its fair value may be far lower, and so will be US living standards. As long as US govt wants hegemony with USD, its domestic policies will be constrained to bail out the global economy- often to its own detriment.
Quantitative Easing, soaring stock markets, strong Dollar all help US as a country enormously, but have severely worsened wealth inequality and brought about populist politics. The big companies get bigger as their size and scale make their borrowing costs lower. Old zombie companies aren’t allowed to fail, and continue to linger. No creative destruction happens.
Crypto is not a serious contender until it is backed by aircraft carrier groups, a nuclear triad, a deep liquid bond market where the bonds are accepted as collateral, and the ability to create the currency out of thin air for credit, while also having legal recourse in case of fraud.
Whether the USD structure as it is remains for another few decades is uncertain, as demographic pressures mount in US, and its share of global GDP declines and intra Asian trade and output rises.
But while it is still there- Watch what the Fed and other major central banks are doing. It remains the key to all the cycles that have played out so far, and will remain so in foreseeable future.
Over the next few posts, we’ll cover specific bubbles- the Dotcom, 2008, the 2020 pandemic, and topics like Chinese growth model, digital sovereign currencies. You can follow me on Twitter , or leave a comment here. Feedback/suggestions for topics welcome.
Have a great weekend!
-Prathamesh Godbole
Excellent write up, thank you for taking the time to write this down.
Excellent write up. Very detailed. It was a pleasure reading this. Thanks.